Discrete colors
3-color palette
# Box plot
bp<-ggplot(ToothGrowth, aes(x=factor(dose), y=len, fill=factor(dose))) +
  geom_boxplot()+theme_bw()
bp + scale_fill_manual(values=c("#999999", "#E69F00", "#56B4E9"))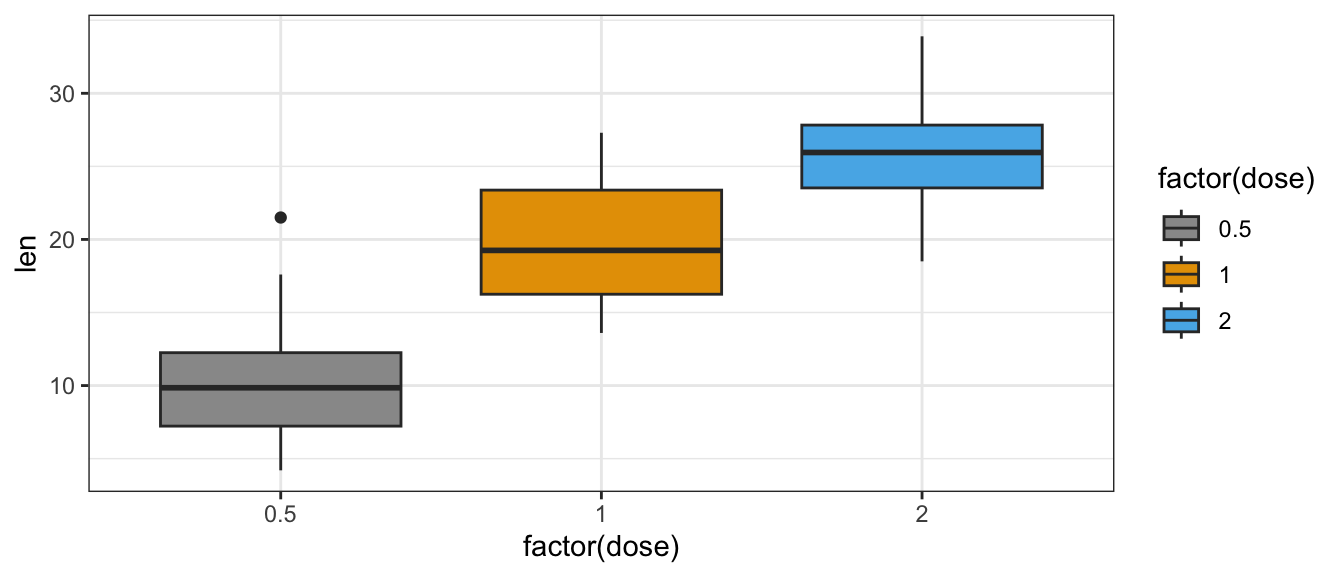
# Scatter plot
sp<-ggplot(mtcars, aes(x=factor(wt), y=mpg, color=factor(cyl))) + geom_point(size=4)+theme_bw()
sp + scale_color_manual(values=c("#999999", "#E69F00", "#56B4E9"))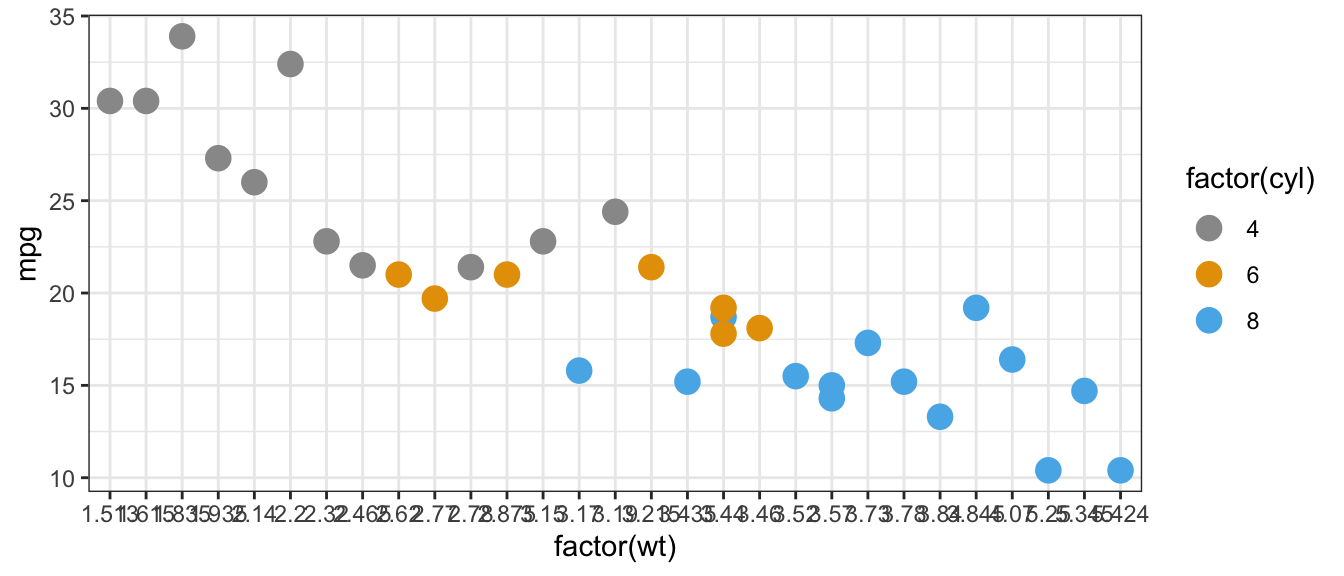
another 3-color palette
# Box plot
bp<-ggplot(ToothGrowth, aes(x=factor(dose), y=len, fill=factor(dose))) +
  geom_boxplot()+theme_bw()
bp + scale_fill_manual(values = c("#00AFBB", "#E7B800", "#FC4E07"))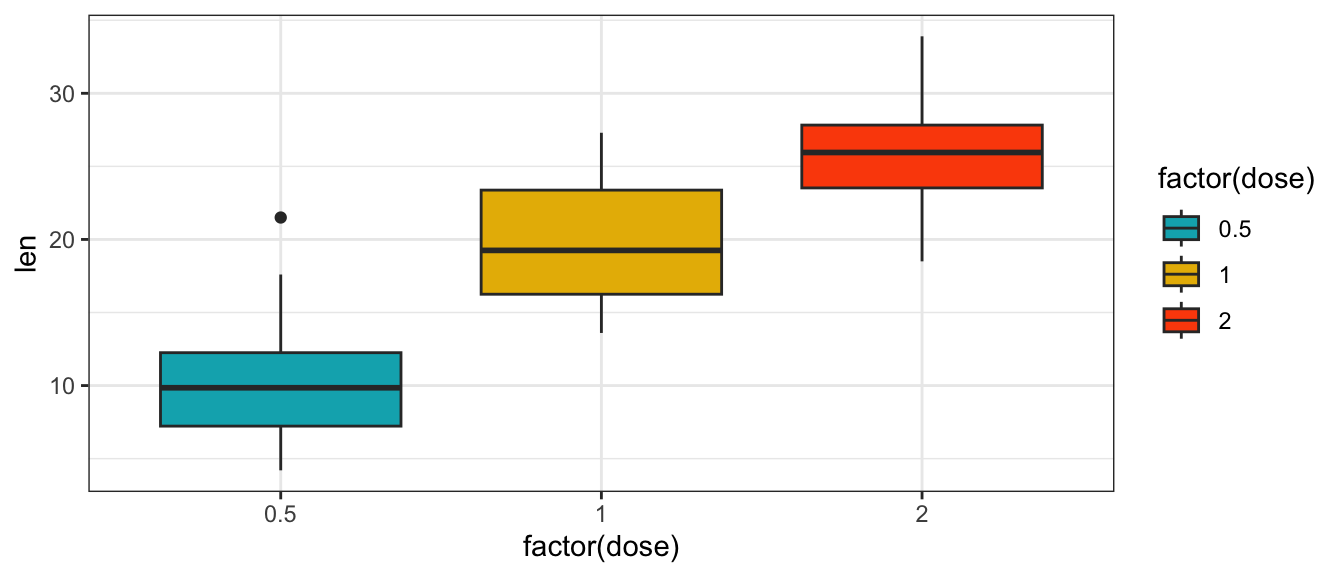
# Scatter plot
sp<-ggplot(mtcars, aes(x=factor(wt), y=mpg, color=factor(cyl))) + geom_point(size=4)+theme_bw()
sp + scale_color_manual(values = c("#00AFBB", "#E7B800", "#FC4E07"))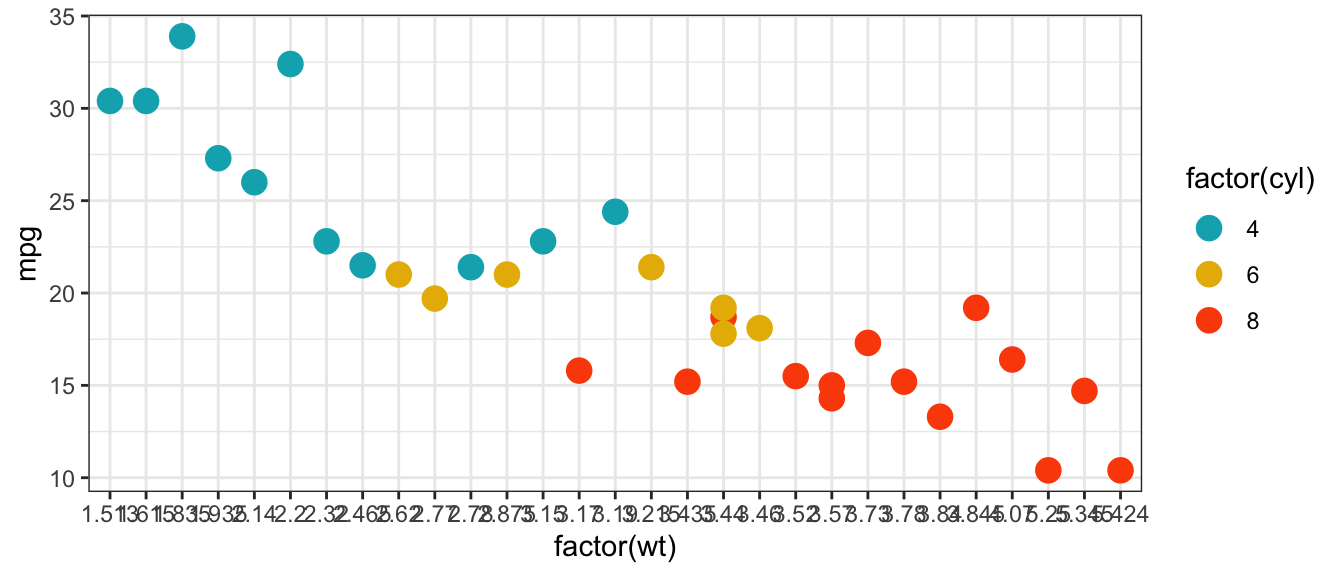
colorblind-friendly palette
custom.col <- c("#FFDB6D", "#C4961A", "#F4EDCA",
                "#D16103", "#C3D7A4", "#52854C", "#4E84C4", "#293352")
barplot(rep(1,length(custom.col)),col=custom.col)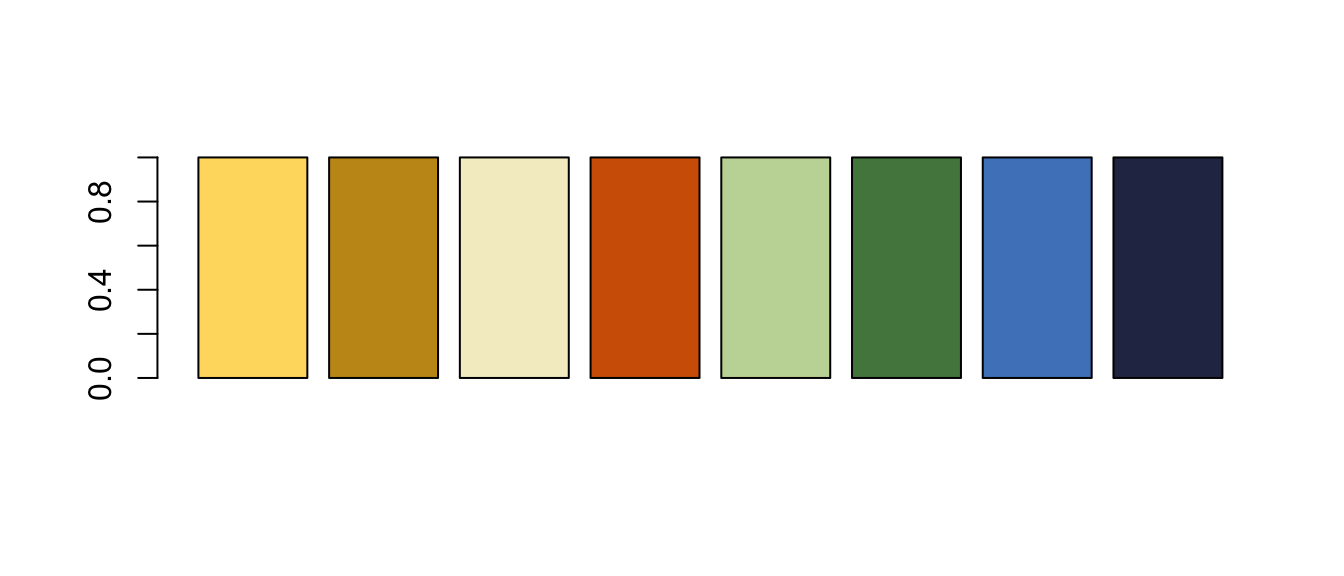
# The palette with grey:
cbp1 <- c("#999999", "#E69F00", "#56B4E9", "#009E73",
          "#F0E442", "#0072B2", "#D55E00", "#CC79A7")
barplot(rep(1,length(cbp1)),col=cbp1)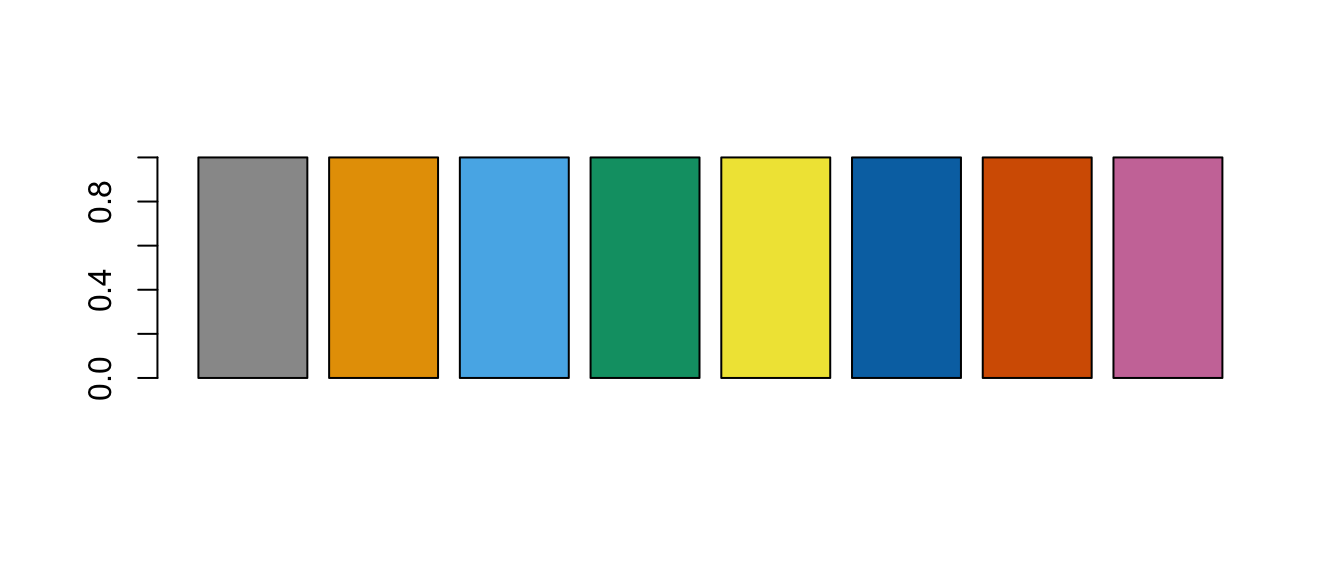
# The palette with black:
cbp2 <- c("#000000", "#E69F00", "#56B4E9", "#009E73",
          "#F0E442", "#0072B2", "#D55E00", "#CC79A7")
barplot(rep(1,length(cbp2)),col=cbp2)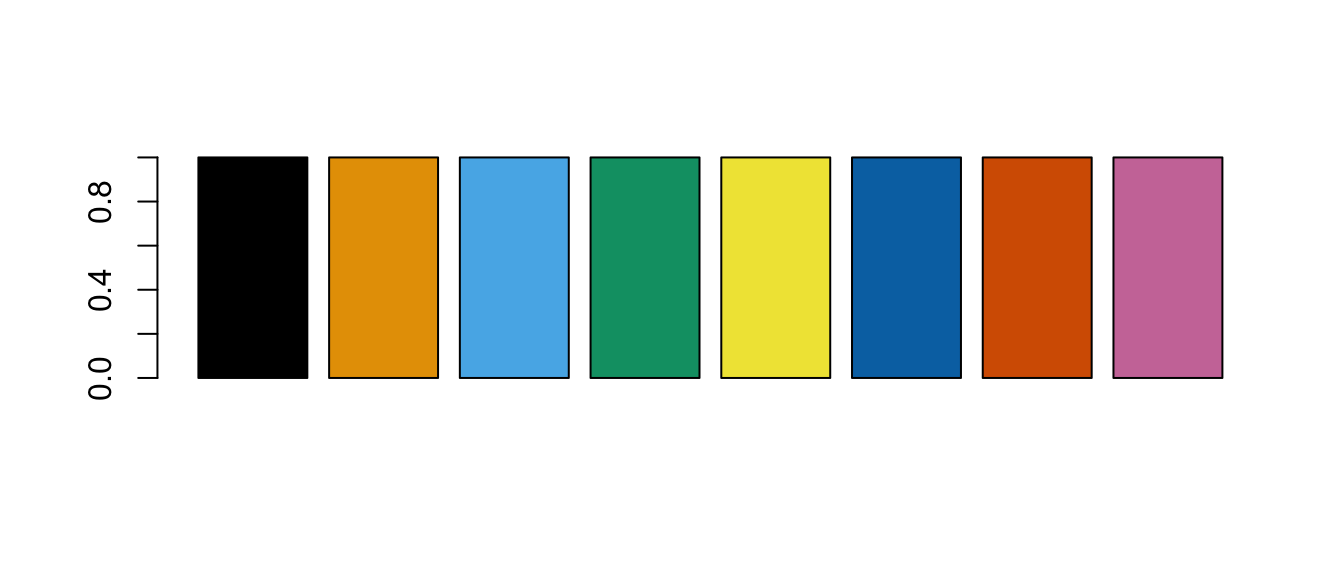
ggplot2 default color palette
refer to: https://stackoverflow.com/questions/8197559/emulate-ggplot2-default-color-palette
library(scales)
hue_pal()(4)
## [1] "#F8766D" "#7CAE00" "#00BFC4" "#C77CFF"#[1] "#F8766D" "#7CAE00" "#00BFC4" "#C77CFF"
show_col(hue_pal()(4))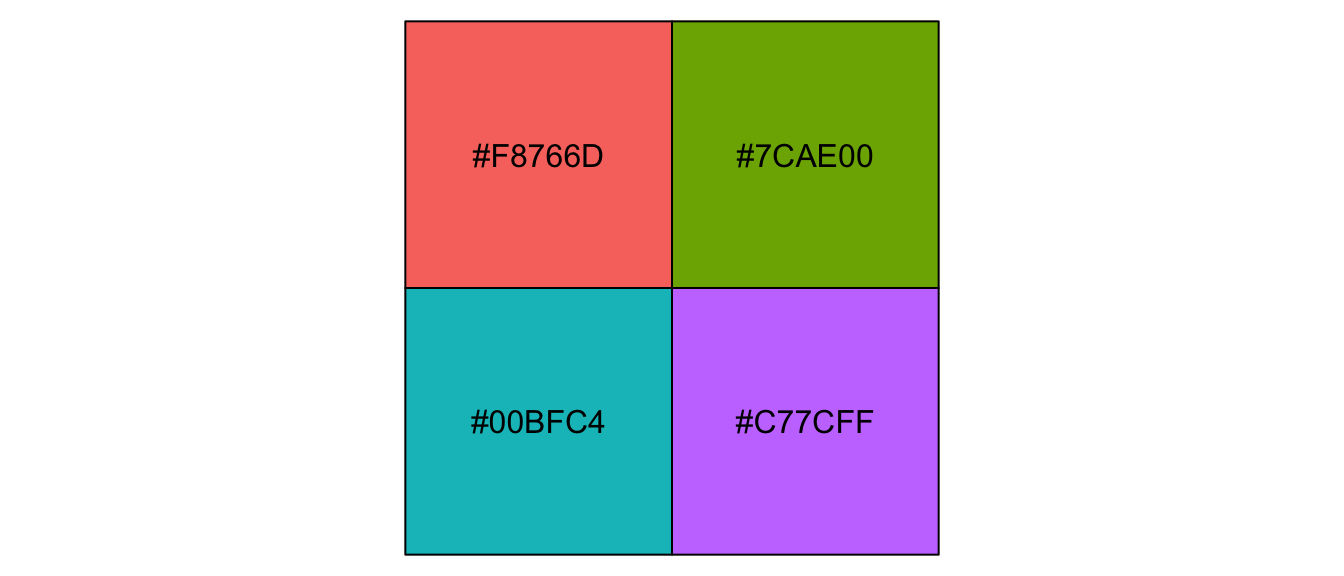
show_col(hue_pal()(3))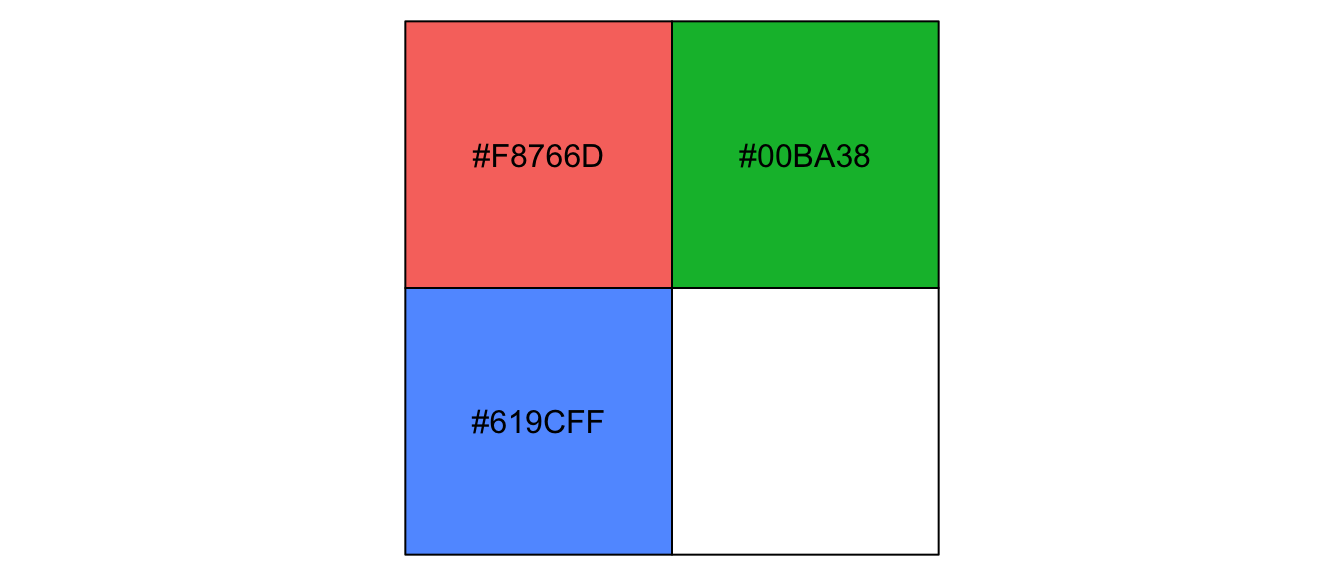
RColorBrewer package
refer to: https://rdrr.io/cran/RColorBrewer/man/ColorBrewer.html
library(RColorBrewer)
brewer.pal.info
## maxcolors category colorblind
## BrBG 11 div TRUE
## PiYG 11 div TRUE
## PRGn 11 div TRUE
## PuOr 11 div TRUE
## RdBu 11 div TRUE
## RdGy 11 div FALSE
## RdYlBu 11 div TRUE
## RdYlGn 11 div FALSE
## Spectral 11 div FALSE
## Accent 8 qual FALSE
## Dark2 8 qual TRUE
## Paired 12 qual TRUE
## Pastel1 9 qual FALSE
## Pastel2 8 qual FALSE
## Set1 9 qual FALSE
## Set2 8 qual TRUE
## Set3 12 qual FALSE
## Blues 9 seq TRUE
## BuGn 9 seq TRUE
## BuPu 9 seq TRUE
## GnBu 9 seq TRUE
## Greens 9 seq TRUE
## Greys 9 seq TRUE
## Oranges 9 seq TRUE
## OrRd 9 seq TRUE
## PuBu 9 seq TRUE
## PuBuGn 9 seq TRUE
## PuRd 9 seq TRUE
## Purples 9 seq TRUE
## RdPu 9 seq TRUE
## Reds 9 seq TRUE
## YlGn 9 seq TRUE
## YlGnBu 9 seq TRUE
## YlOrBr 9 seq TRUE
## YlOrRd 9 seq TRUE#par(mar=c(3,4,2,2))
#display.brewer.all()
(mycol=brewer.pal(10,"Paired"))## [1] "#A6CEE3" "#1F78B4" "#B2DF8A" "#33A02C" "#FB9A99" "#E31A1C" "#FDBF6F"
## [8] "#FF7F00" "#CAB2D6" "#6A3D9A"barplot(rep(1,10),col=mycol)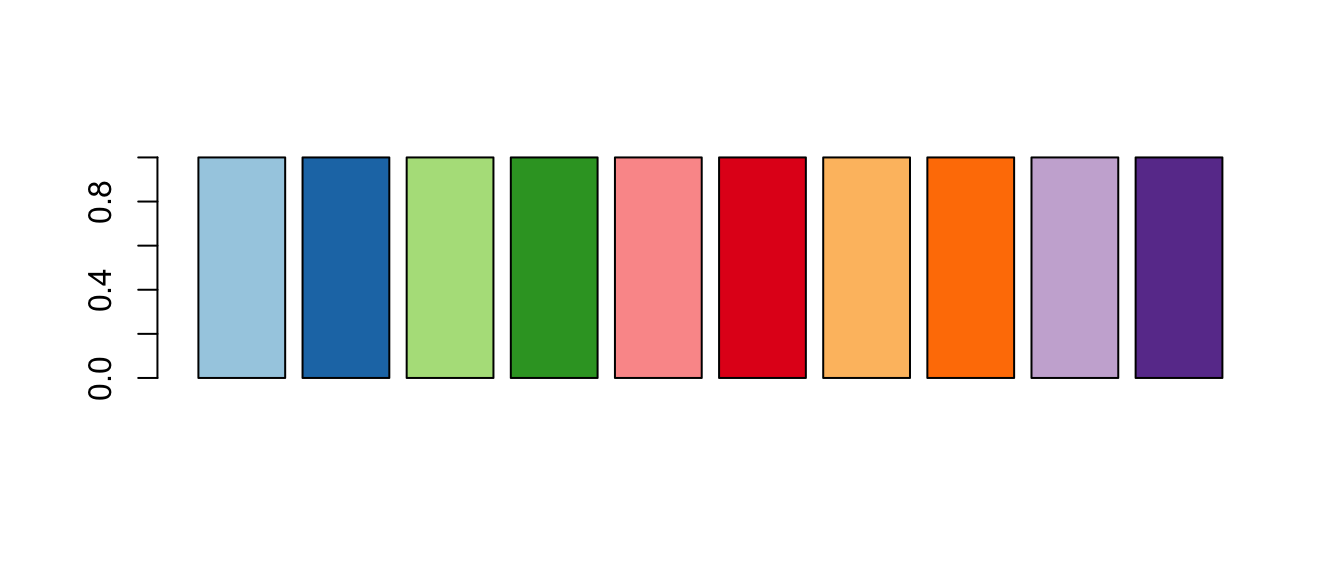
(mycol=brewer.pal(8,"Dark2"))## [1] "#1B9E77" "#D95F02" "#7570B3" "#E7298A" "#66A61E" "#E6AB02" "#A6761D"
## [8] "#666666"barplot(rep(1,8),col=mycol)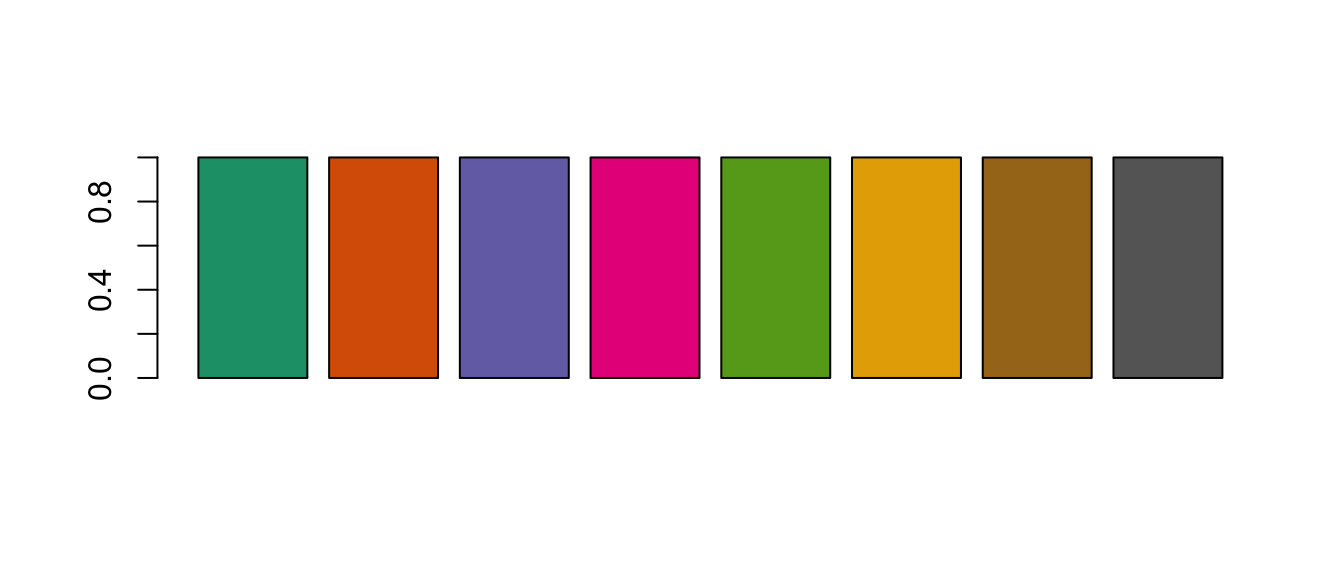
Continuous colors
scale_xxx_gradient()
frequently used in heatmaps refer to: http://www.sthda.com/english/wiki/ggplot2-colors-how-to-change-colors-automatically-and-manually#continuous-colors
The graph can be colored according to the values of a continuous variable using the functions :
- scale_color_gradient(), scale_fill_gradient() for sequential gradients between two colors
- scale_color_gradient2(), scale_fill_gradient2() for diverging gradients
- scale_color_gradientn(), scale_fill_gradientn() for gradient between n colors
# Color by qsec values
sp<-ggplot(mtcars, aes(x=wt, y=mpg, color=qsec)) + geom_point() +theme_bw()
#sp
summary(mtcars$qsec)
## Min. 1st Qu. Median Mean 3rd Qu. Max.
## 14.50 16.89 17.71 17.85 18.90 22.90sp+scale_color_gradient2(low="blue", mid = "white",high="red",
midpoint = quantile(mtcars$qsec,0.25))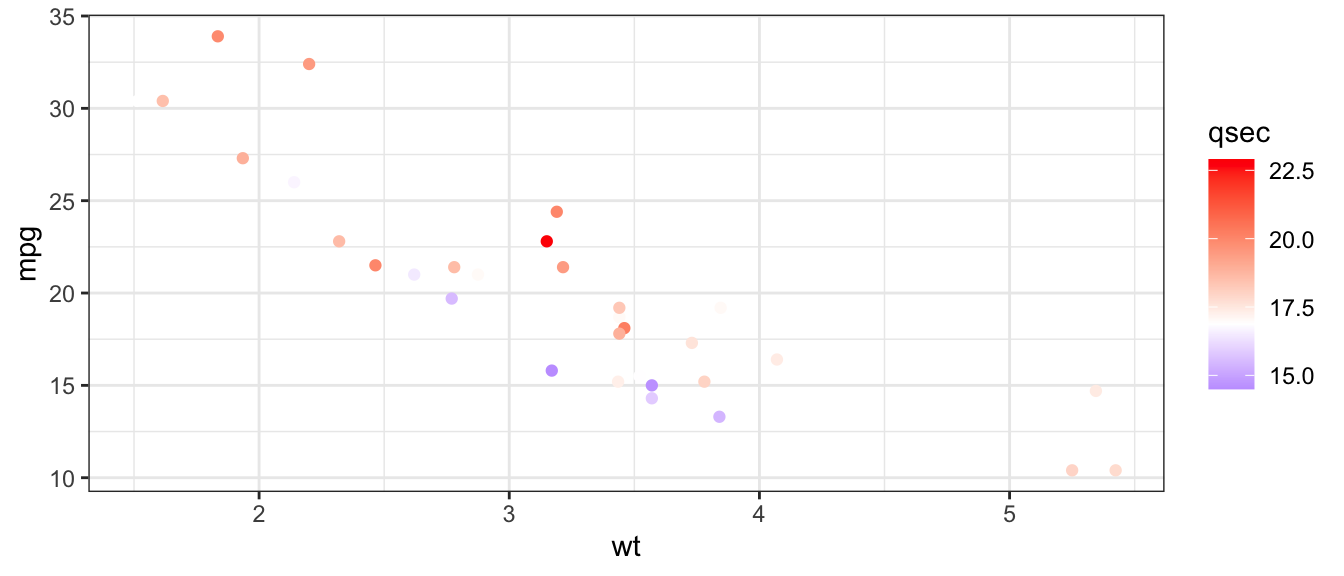
viridis package
useful refs:
- https://cran.r-project.org/web/packages/viridis/vignettes/intro-to-viridis.html
- https://www.thinkingondata.com/something-about-viridis-library/
- https://sjmgarnier.github.io/viridisLite/reference/viridis.html
- https://bookdown.org/hneth/ds4psy/D-4-apx-colors-pkgs.html
library(viridis)
ggplot(data.frame(x = rnorm(10000), y = rnorm(10000)), aes(x = x, y = y))+
  geom_hex() + coord_fixed() +
  scale_fill_viridis() + theme_bw()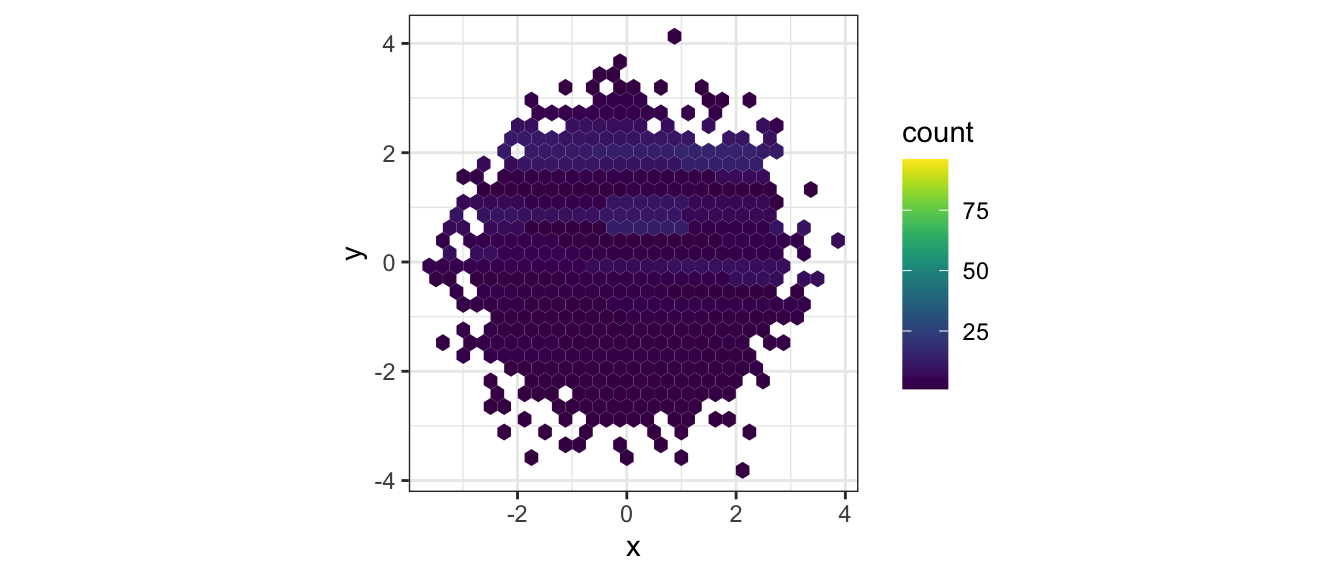
It’s also easier to adjust continuous colors into discrete ones with the viridis package.
p <- ggplot(mtcars, aes(wt, mpg))+
    geom_point(size=4, aes(colour = factor(cyl))) +
    theme_bw()
p+scale_color_viridis(discrete=TRUE,option = 'viridis') 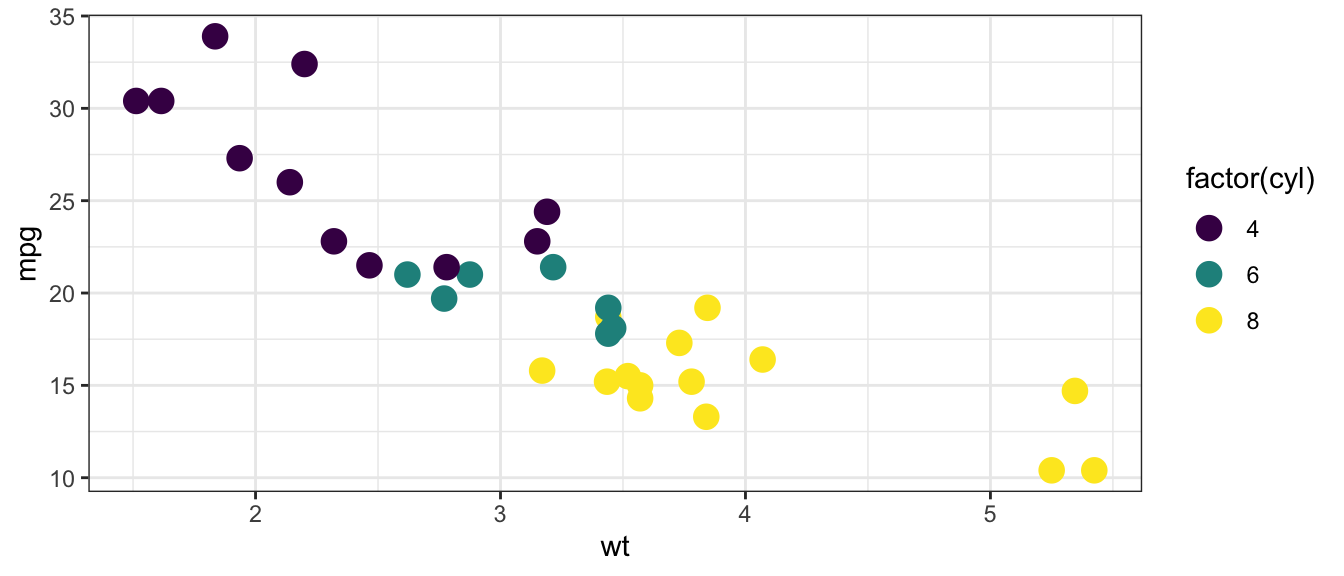
p+scale_color_viridis(discrete=TRUE,option = 'magma') 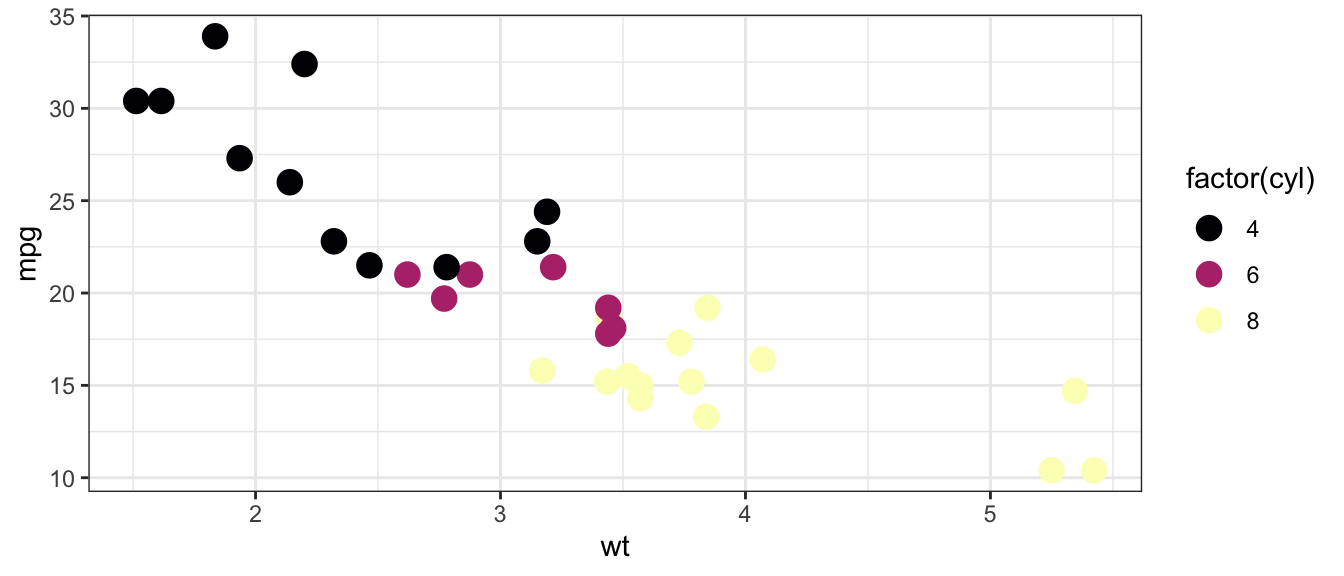
p+scale_color_viridis(discrete=TRUE,option = 'turbo') 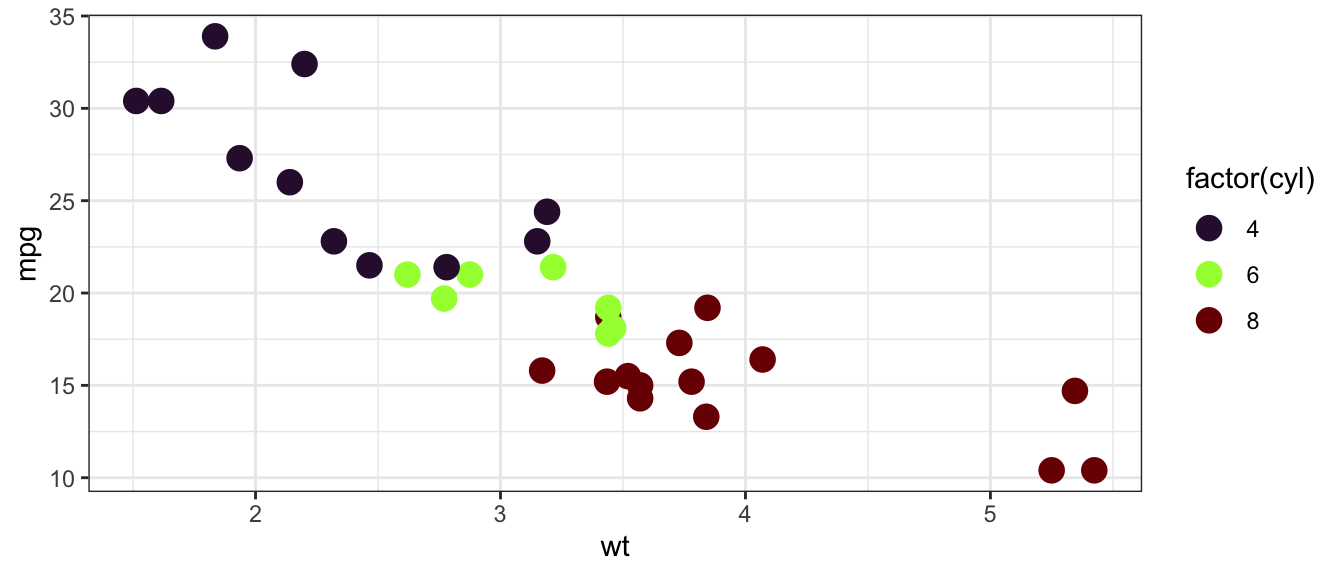
library(viridisLite)  # load package
library(unikn) #seecol function
vir_10 <- viridis(n = 10)
seecol(vir_10, col_brd = "white", lwd_brd = 4,
       title = "Example of a viridis color palette (n = 10)",
       pal_names = paste0("viridis_", 1:10))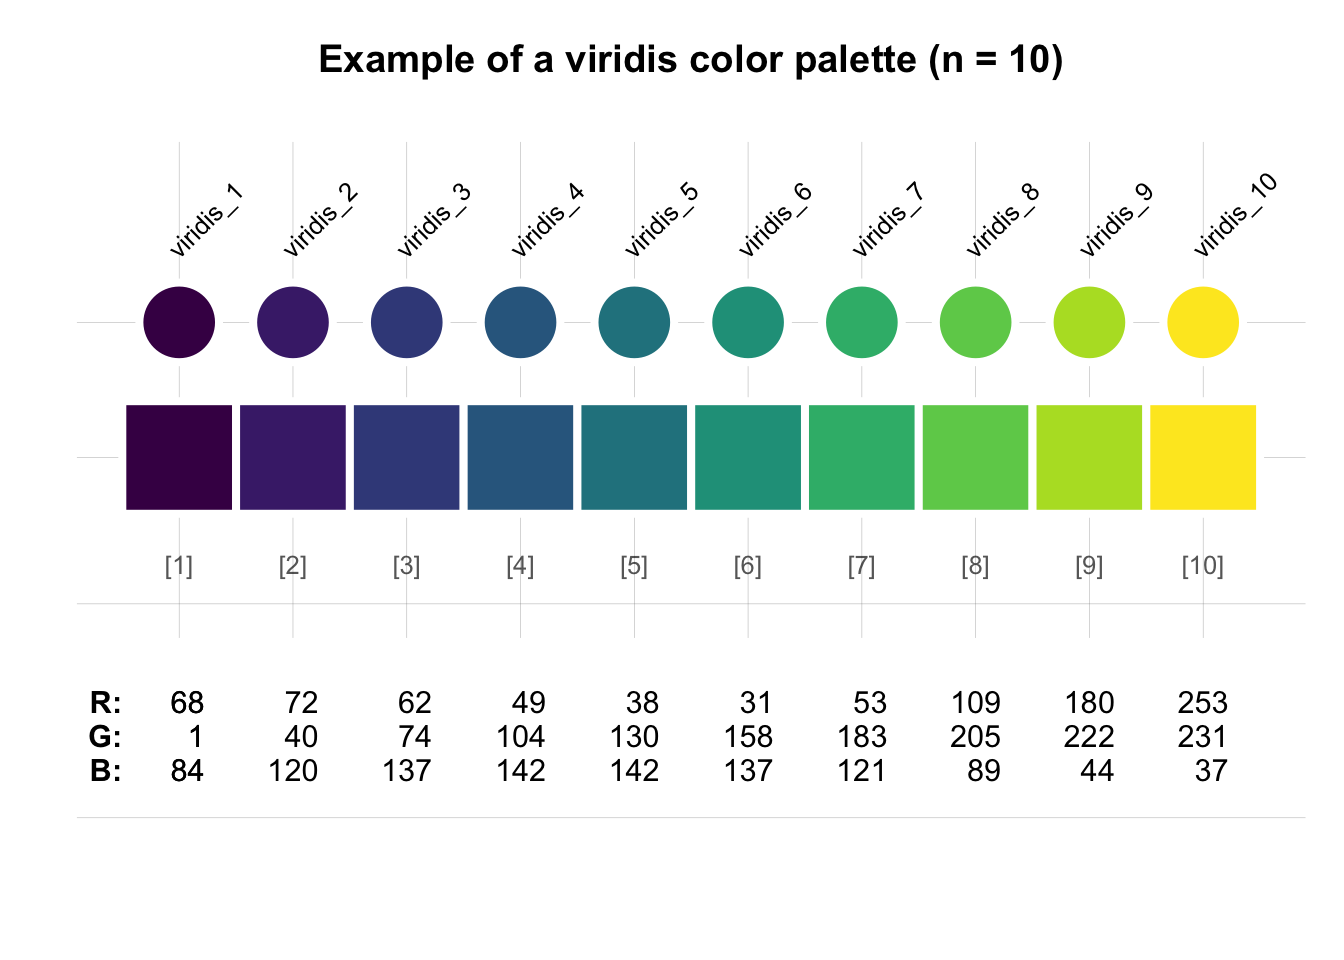
Other R color combos that are colorblind-friendly
8-color palette
colorBlindBlack8  <- c("#000000", "#E69F00", "#56B4E9", "#009E73",
                       "#F0E442", "#0072B2", "#D55E00", "#CC79A7")
pie(rep(1, 8), col = colorBlindBlack8)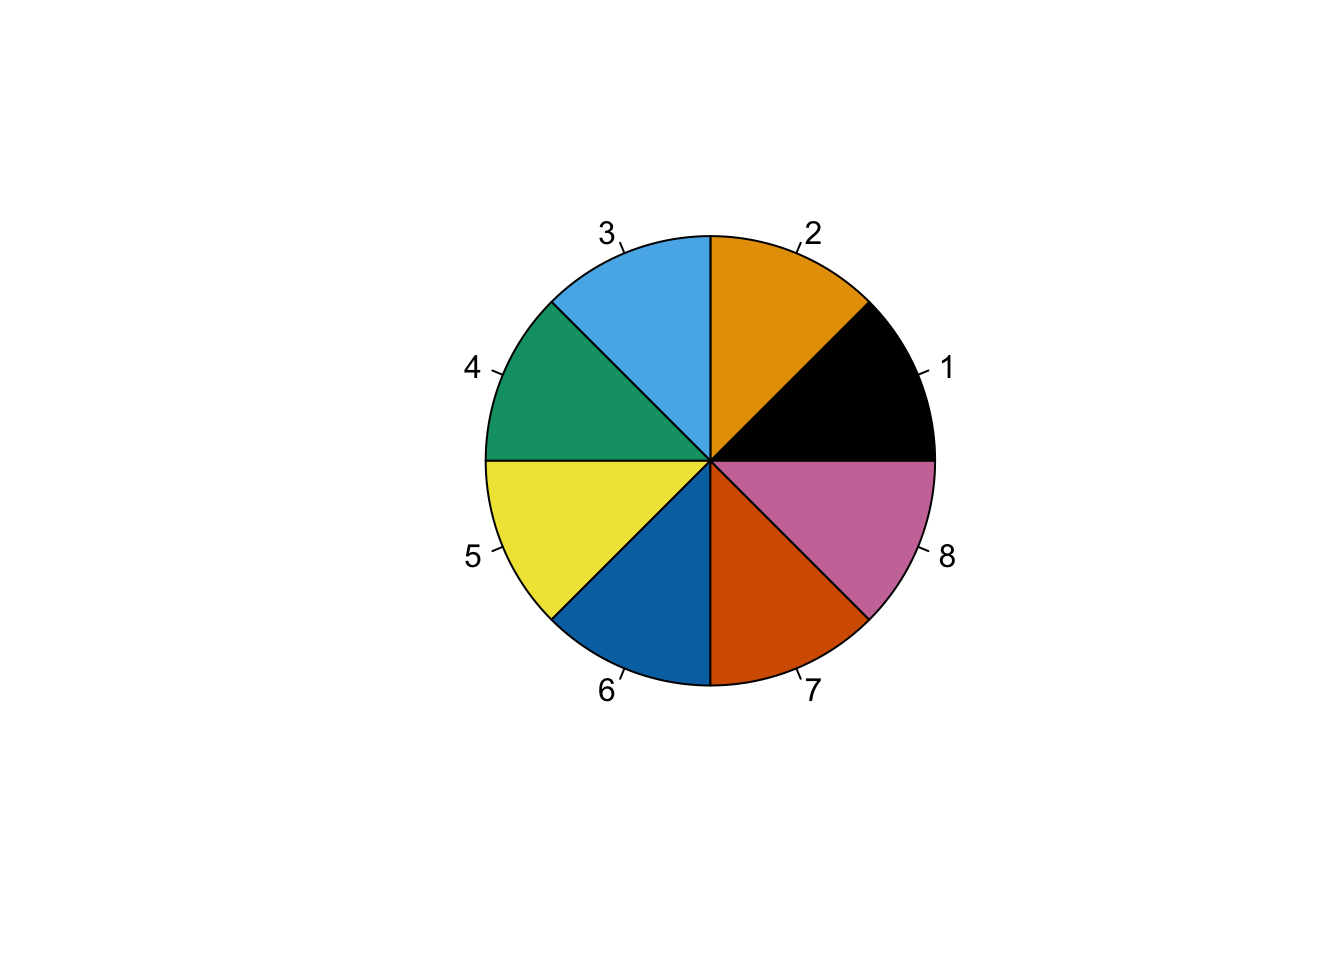
colorBlindGrey8   <- c("#999999", "#E69F00", "#56B4E9", "#009E73",
                       "#F0E442", "#0072B2", "#D55E00", "#CC79A7")
scales::show_col(colorBlindGrey8)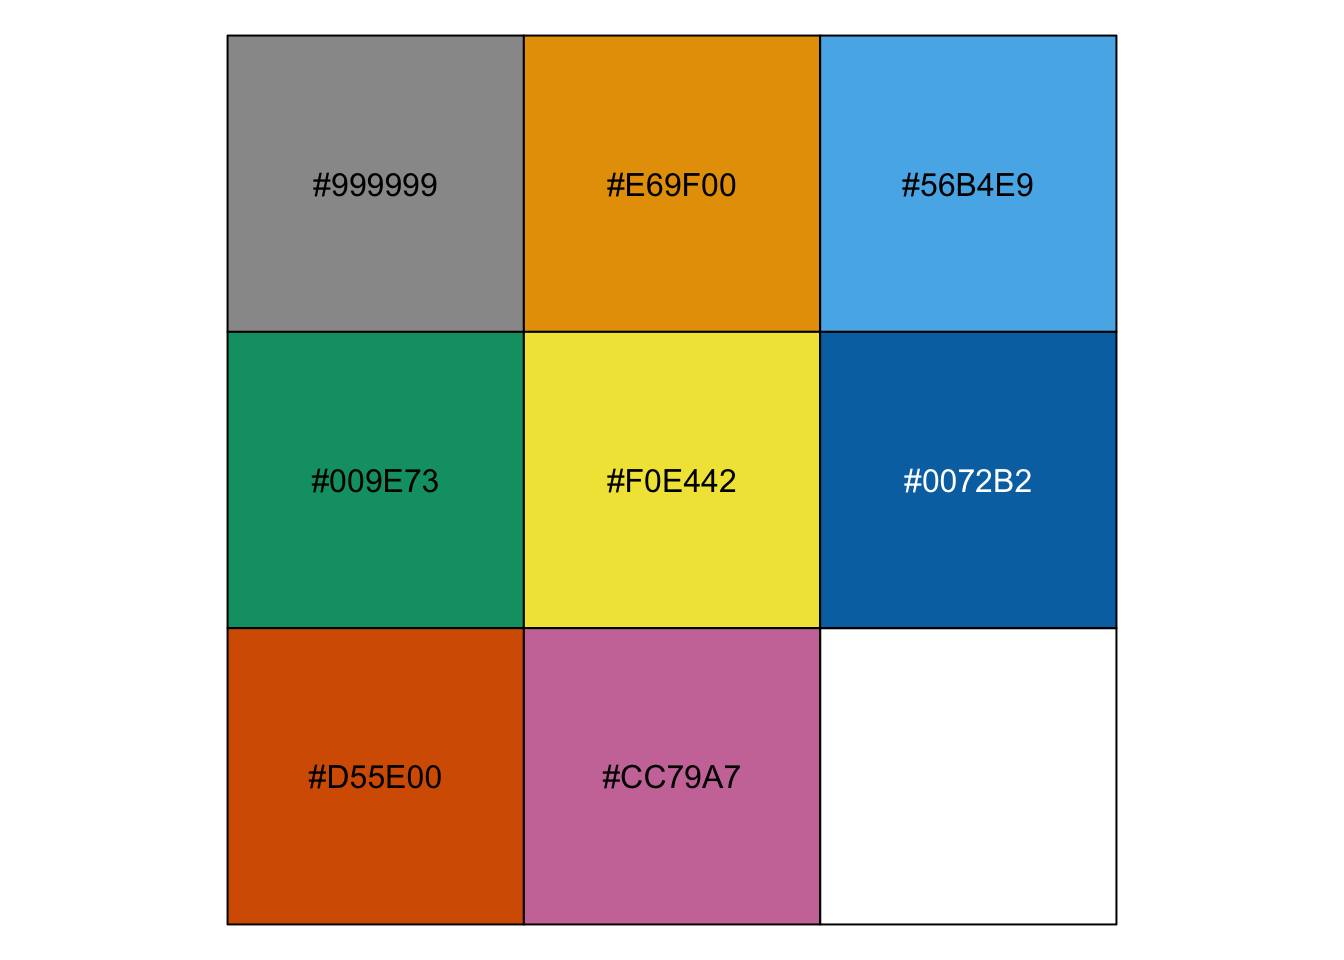
12-color palette
safe_colorblind_palette <- c("#88CCEE", "#CC6677", "#DDCC77", "#117733", "#332288", "#AA4499",
                             "#44AA99", "#999933", "#882255", "#661100", "#6699CC", "#888888")
scales::show_col(safe_colorblind_palette)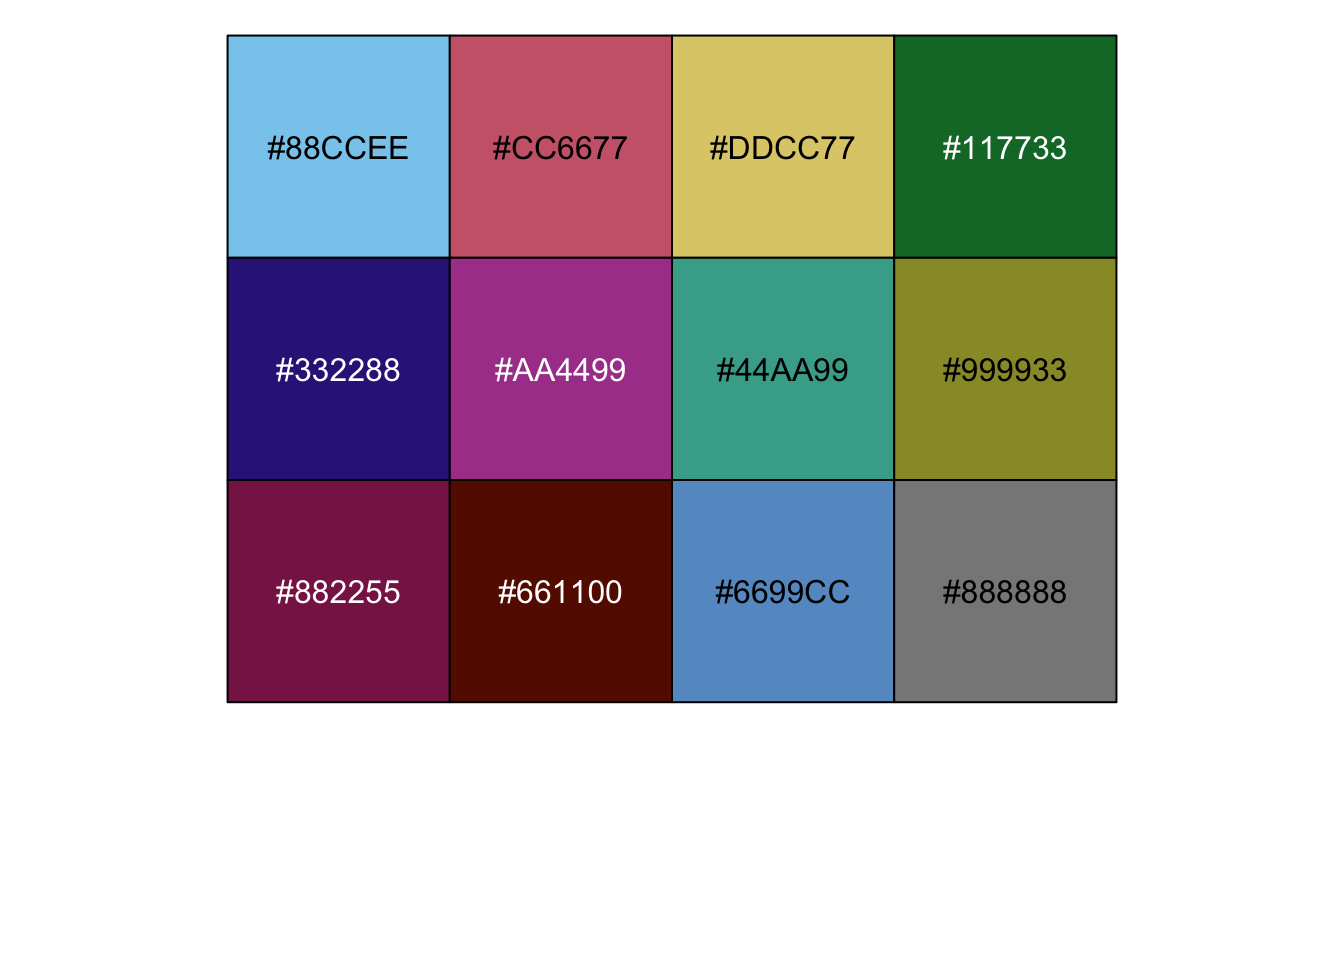
RColorBrewer: display.brewer.all(colorblindFriendly = T)
refer to: colorblind-friendly-palettes
library(RColorBrewer)
display.brewer.all(colorblindFriendly = T)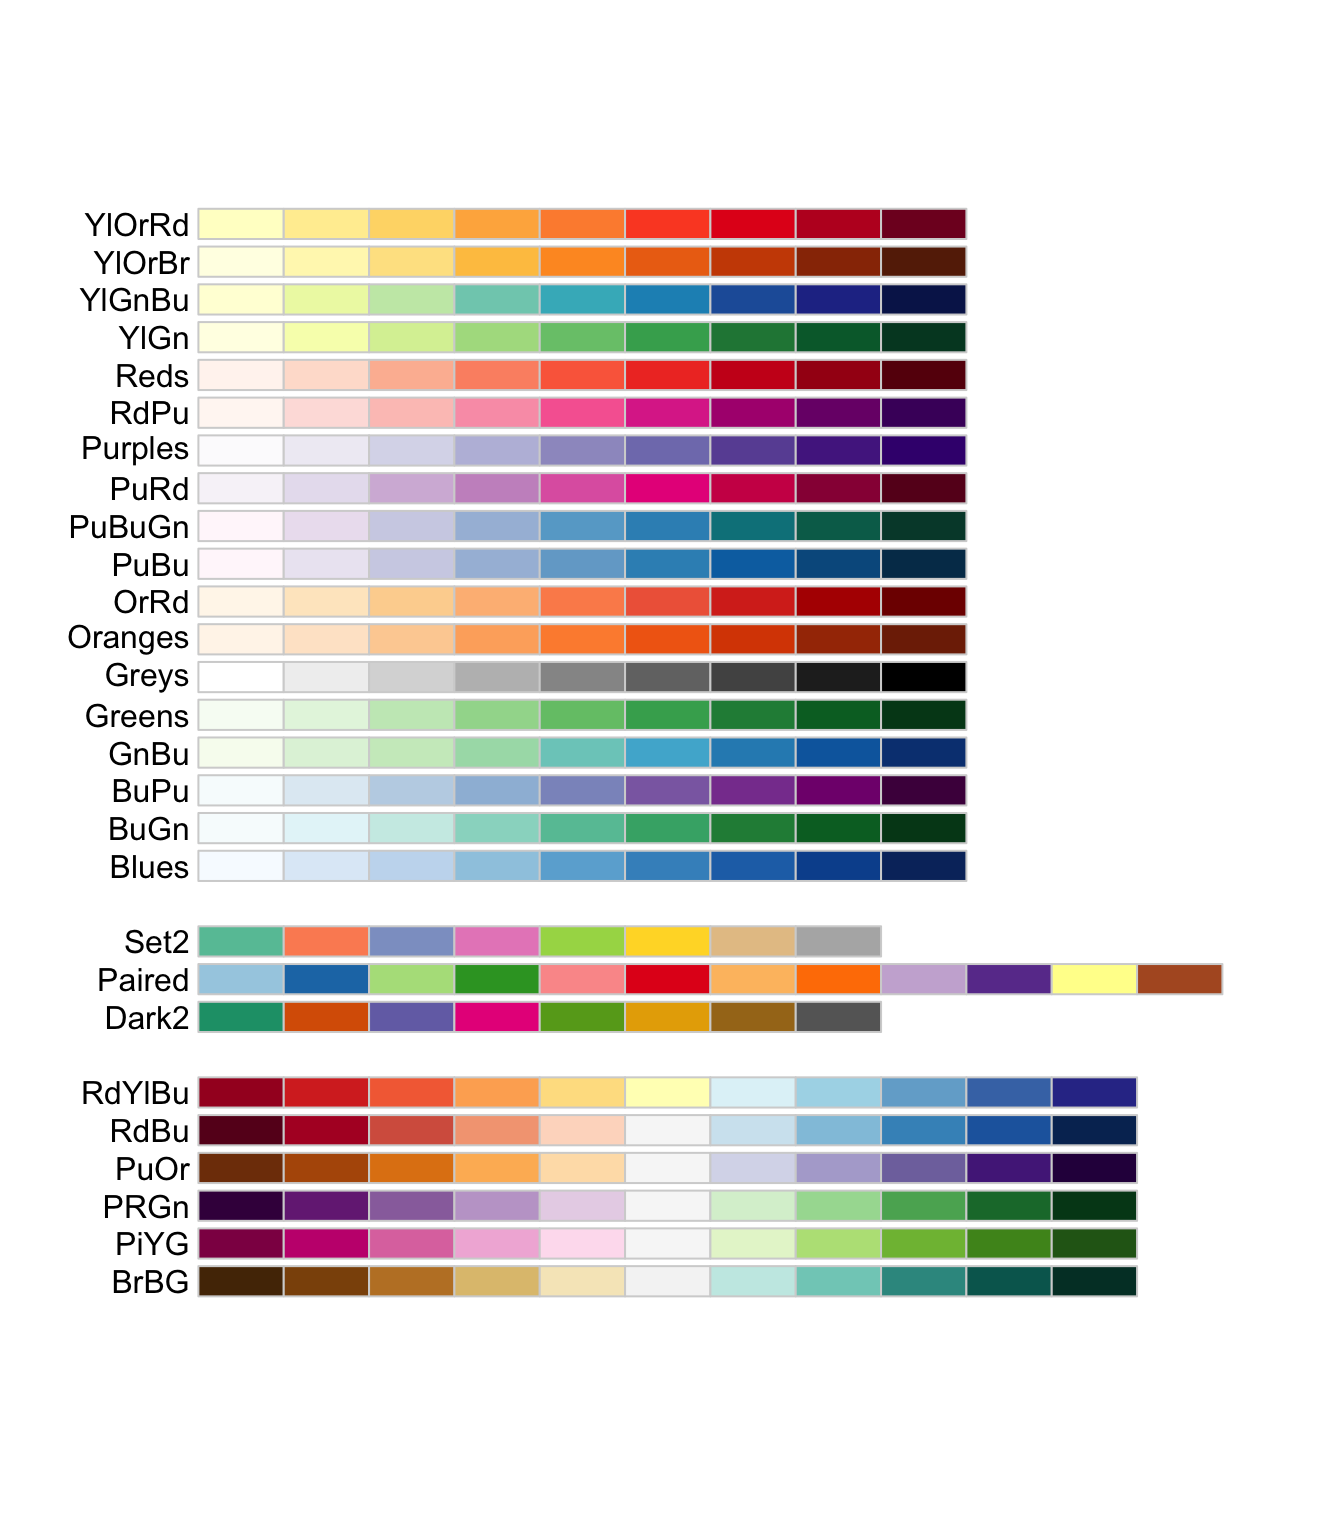
#palette using grey
cbPalette <- c("#999999", "#E69F00", "#56B4E9", "#009E73", "#F0E442", "#0072B2", "#D55E00", "#CC79A7")
scales::show_col(cbPalette)
#palette using black
cbbPalette <- c("#000000", "#E69F00", "#56B4E9", "#009E73", "#F0E442", "#0072B2", "#D55E00", "#CC79A7")
scales::show_col(cbPalette)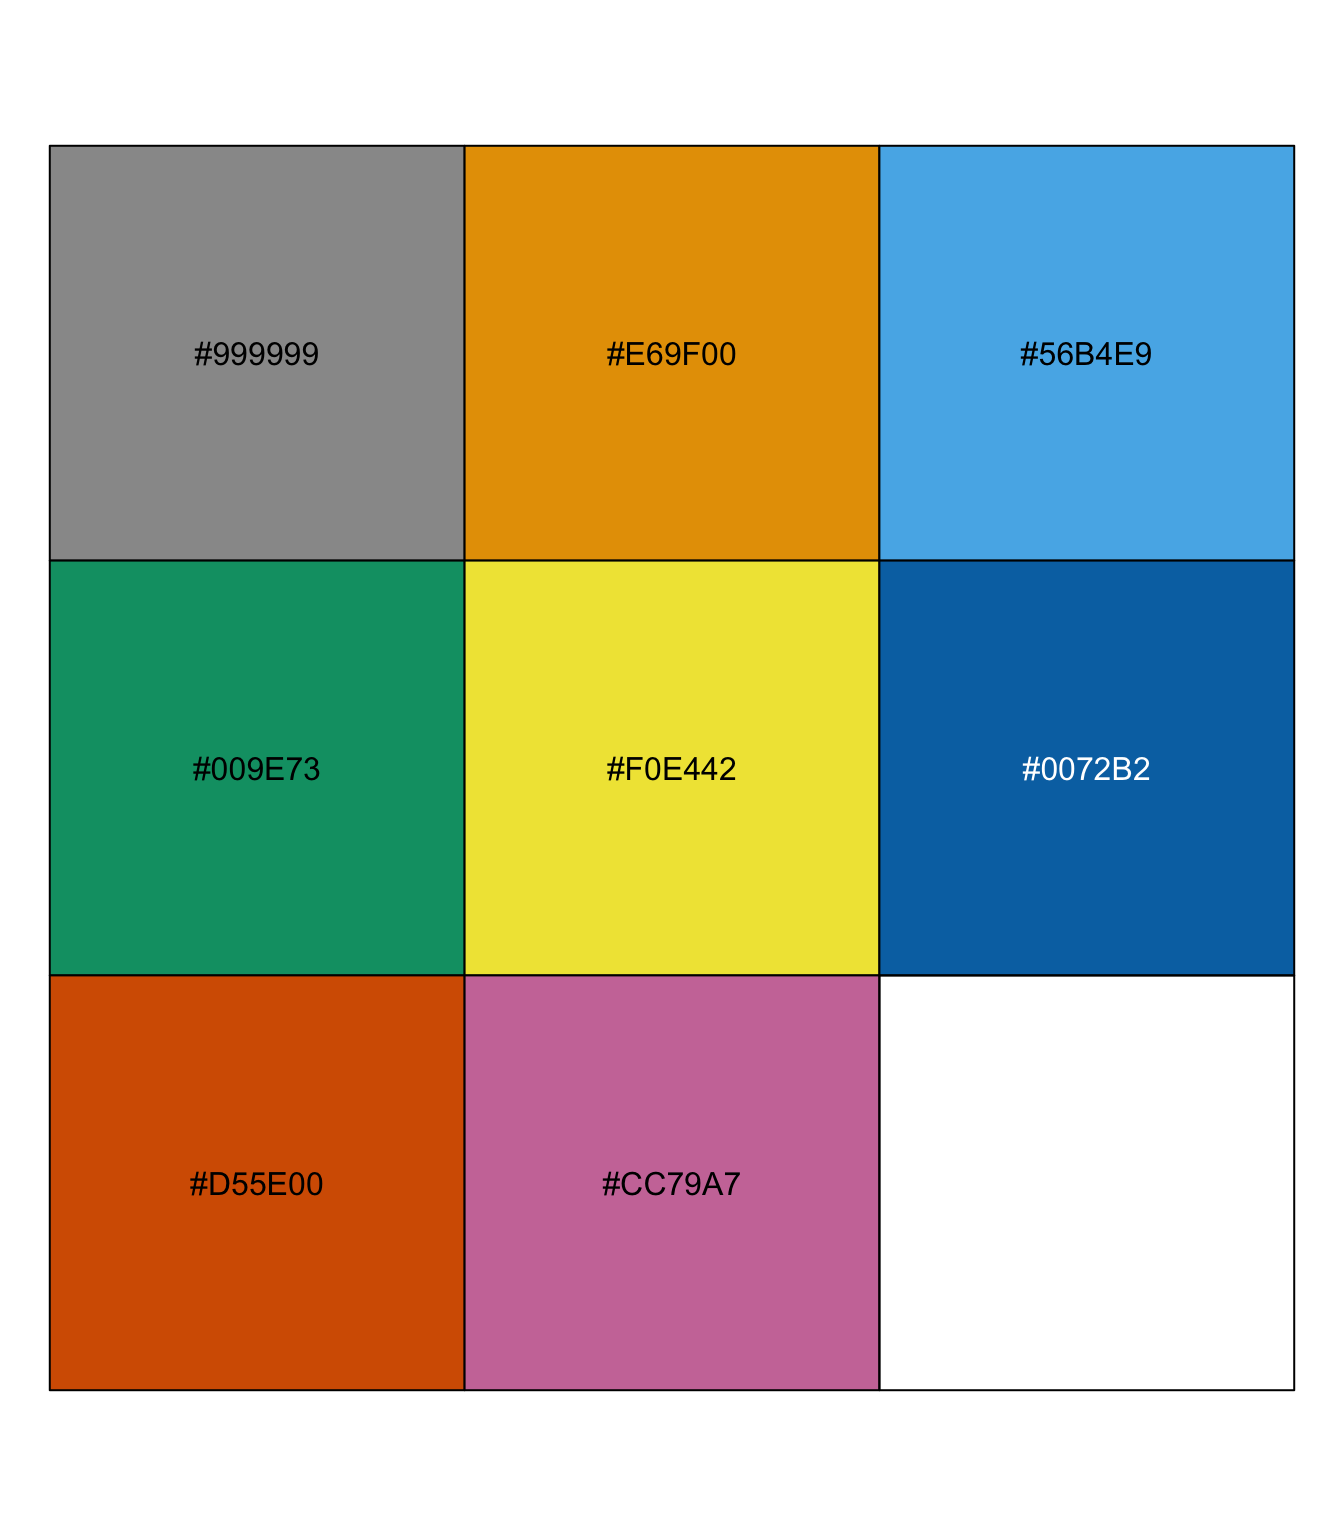
Miscellaneous
make transparent colors in R
refer to: Make transparent colors in R
## Transparent colors
## Mark Gardener 2015
## www.dataanalytics.org.uk

t_col <- function(color, percent = 50, name = NULL) {
  #      color = color name
  #      percent = % transparency
  #      name = an optional name for the color

  ## Get RGB values for named color
  #rgb.val <- col2rgb(color)

  rgb.val=col2rgb(color)

  ## Make new color using input color as base and alpha set by transparency
  t.col <- rgb(rgb.val[1], rgb.val[2], rgb.val[3],
               max = 255,
               alpha = (100 - percent) * 255 / 100,
               names = name)

  ## Save the color
  #invisible(t.col)
  t.col
}
my.cols=c('black','orange','sky blue','yellow','blue');
my.cols
## [1] "black" "orange" "sky blue" "yellow" "blue"my.cols2=sapply(my.cols,function(i){t_col(i,percent=80)})
my.cols2## black orange sky blue yellow blue
## "#00000033" "#FFA50033" "#87CEEB33" "#FFFF0033" "#0000FF33"par(mfrow=c(2,1))
barplot(1:length(my.cols),col=my.cols)
barplot(1:length(my.cols),col=my.cols2)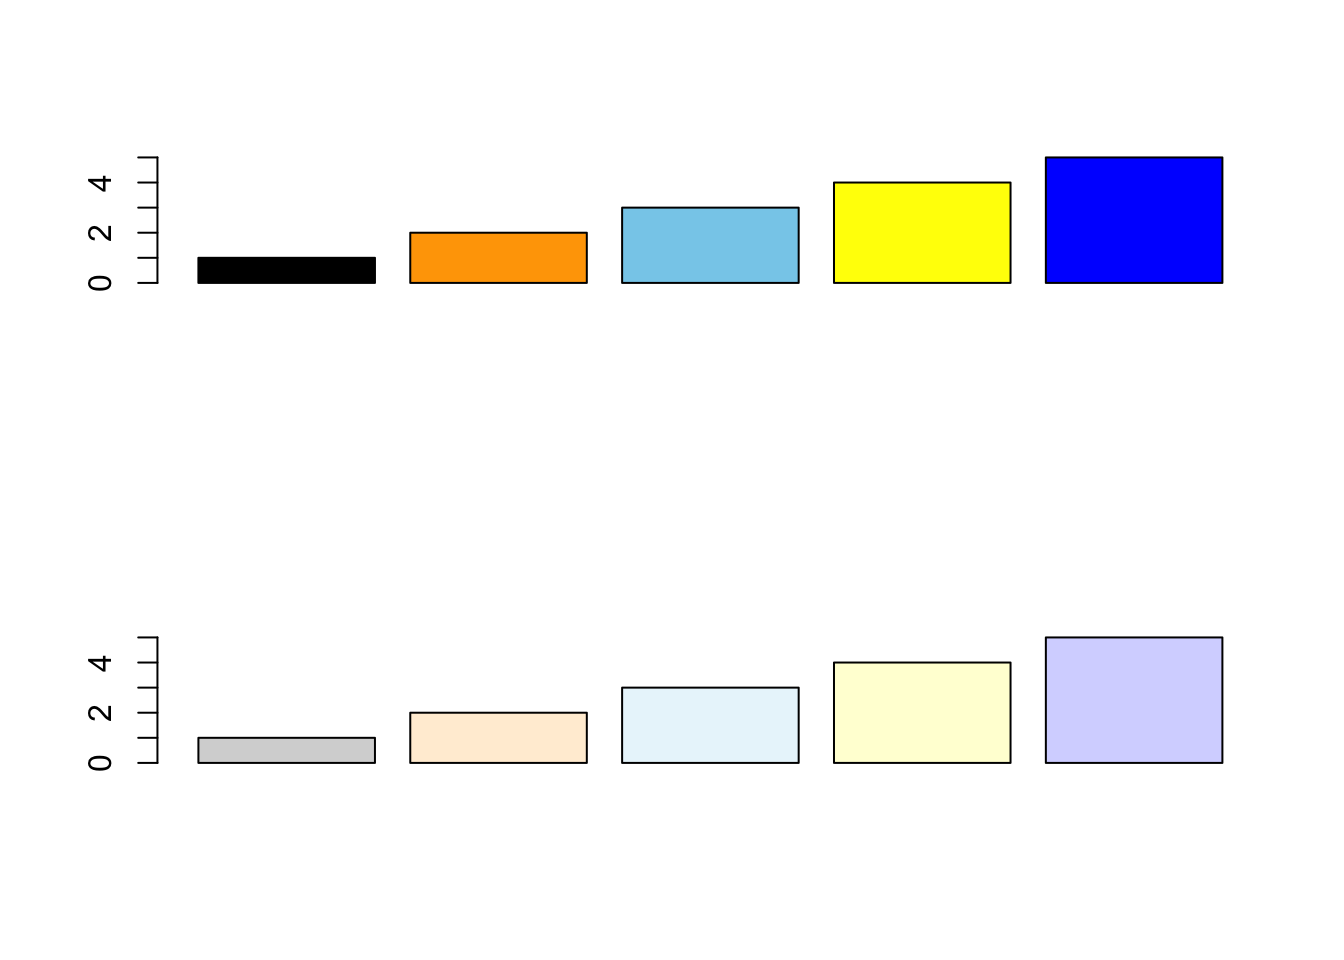
Useful resources
- sthda: how to change colors automatically and manually
- GGPlot Colors Best Tricks You Will Love by Alboukadel
- stackoverflow: r-plot-color-combinations-that-are-colorblind-accessible
- color-safe-palett
- tokyo.ac.jp
#installed.packages()[names(sessionInfo()$otherPkgs), "Version"]
sessionInfo()
## R version 4.1.3 (2022-03-10)
## Platform: x86_64-apple-darwin17.0 (64-bit)
## Running under: macOS Big Sur/Monterey 10.16
##
## Matrix products: default
## BLAS: /Library/Frameworks/R.framework/Versions/4.1/Resources/lib/libRblas.0.dylib
## LAPACK: /Library/Frameworks/R.framework/Versions/4.1/Resources/lib/libRlapack.dylib
##
## locale:
## [1] en_US.UTF-8/en_US.UTF-8/en_US.UTF-8/C/en_US.UTF-8/en_US.UTF-8
##
## attached base packages:
## [1] stats graphics grDevices utils datasets methods base
##
## other attached packages:
## [1] unikn_0.5.0 viridis_0.6.2 viridisLite_0.4.0 RColorBrewer_1.1-2
## [5] scales_1.2.1 ggplot2_3.4.0
##
## loaded via a namespace (and not attached):
## [1] tidyselect_1.1.1 xfun_0.39 bslib_0.3.1 purrr_0.3.4
## [5] lattice_0.20-45 colorspace_2.0-2 vctrs_0.5.1 generics_0.1.2
## [9] htmltools_0.5.2 yaml_2.3.4 utf8_1.2.2 rlang_1.0.6
## [13] hexbin_1.28.2 jquerylib_0.1.4 pillar_1.7.0 glue_1.6.1
## [17] withr_2.5.0 DBI_1.1.2 lifecycle_1.0.3 stringr_1.4.0
## [21] munsell_0.5.0 blogdown_1.17.2 gtable_0.3.0 evaluate_0.15
## [25] labeling_0.4.2 knitr_1.37 fastmap_1.1.0 fansi_1.0.2
## [29] highr_0.9 jsonlite_1.8.0 farver_2.1.0 gridExtra_2.3
## [33] digest_0.6.29 stringi_1.7.8 bookdown_0.25 dplyr_1.0.8
## [37] grid_4.1.3 cli_3.5.0 tools_4.1.3 magrittr_2.0.2
## [41] sass_0.4.0 tibble_3.1.6 crayon_1.5.0 pkgconfig_2.0.3
## [45] ellipsis_0.3.2 assertthat_0.2.1 rmarkdown_2.13 rstudioapi_0.13
## [49] R6_2.5.1 compiler_4.1.3